@oj-sec
Shadowpuppet: Analysing Unstructured Data Using Semantic Scatter Plots
28 April 2025 - 10 min read
You can find source code and executables for Shadowpuppet, the tool discussed in this blog, here.
Introduction
Semantic scatter plots are graphs that represent points with a closer meaning more closely on a graph. This method of representing data can uncover patterns that are difficult to discern using conventional approaches, particularly over very large natural language and code datasets. Semantic scatter plots provide a deeply contextual view into dataset because it's the relative nuance within the data being represented rather than objective features. This can make patterns that we wouldn't know to look for self-revealing.
In this blog, I'll introduce a semantic scatter plot tool I've been working on called Shadowpuppet. I'll provide some background on semantic scatter plots and a quick demo of the tool on communications leaked from the Black Basta cyber extortion group. This blog should set you up with some ideas to run this technique on your own data.
Semantic Scatter Plots
The first step in creating a semantic scatter plot is to use an embedding model to create a high-dimensional representation of the meaning of source data. Embedding models are similar to the encoder portion of a Large Language Models (LLMs) in that both serve to represent input data numerically in a latent space based on patterns learned through the magic of training transformers over a massive dataset. Embedding models differ in that their entire purpose is to output these numeric representations, called vectors, with no decoder or generative stage. The output of an embedding model is specialised for creating representations that capture similarity and contrast.
The concept of the high-dimensional representation is important for us to understand. Embedding models output vectors containing long sequences, commonly 768 or 1024 numbers in an array. These numbers are just like [x,y] coordinates in a 2d space or [x,y,z] coordinates in a 3d space, only in a space that is massive, hugely beyond our ability to think reason about in real world spatial terms. The complexity of the space scales exponentially with each added dimension, giving us a hugely descriptive space in which our data's meaning can be chraracterised.
Once we have our high-dimensional vectors, our next step is to use a dimension reduction technique to get back down into a 2d space we can graph. By way of example, dimension reduction is like making a shadow puppet using light projected against a wall. We take a three-dimensional object, our hand, and project a two-dimensional shape onto the wall. The projection still contains a lot of important spatial data that evokes the original shape and gives us a simpler representation we can more easily understand.
Approaches to achieving dimension reduction generally revolve around some form of principal component analysis where important high-dimensional structure is preserved as we project down. It's the combination of these two phases that make this a powerful technique - we get an incredibly rich representation of the data initially using embeddings and then get a deeply contextual final product when we reduce dimensions.
Introducing Shadowpuppet
Semantic scatter plots are a tool I've found myself throwing at a lot of threat intelligence problems over the last year. I've put together Shadowpuppet to streamline my workflow and hope it might be useful to share with others as well. Examples of instances where semantic scatter plots have let me perform unique analysis in a threat intelligence context have included:
- analysing more than 50,000 social media posts produced by an information operation capability to identify coordination in political narratives
- analysing Chrome browser API invocation in more than 100,000 browser extensions to pivot from known suspicious activity to behaviorally similar extensions
Shadowpuppet is available for Windows, macOS and Linux and uses embeddings computed locally, making it potentially suitable for handling sensitive data. For Windows and macOS, I've produced bundled Tauri executables that mean you don't need to open your terminal to run Shadowpuppet. Shadowpuppet currently supports Sentence Transformer-compatible embedding models for embeddings and the PaCMAP technique for dimension reduction.
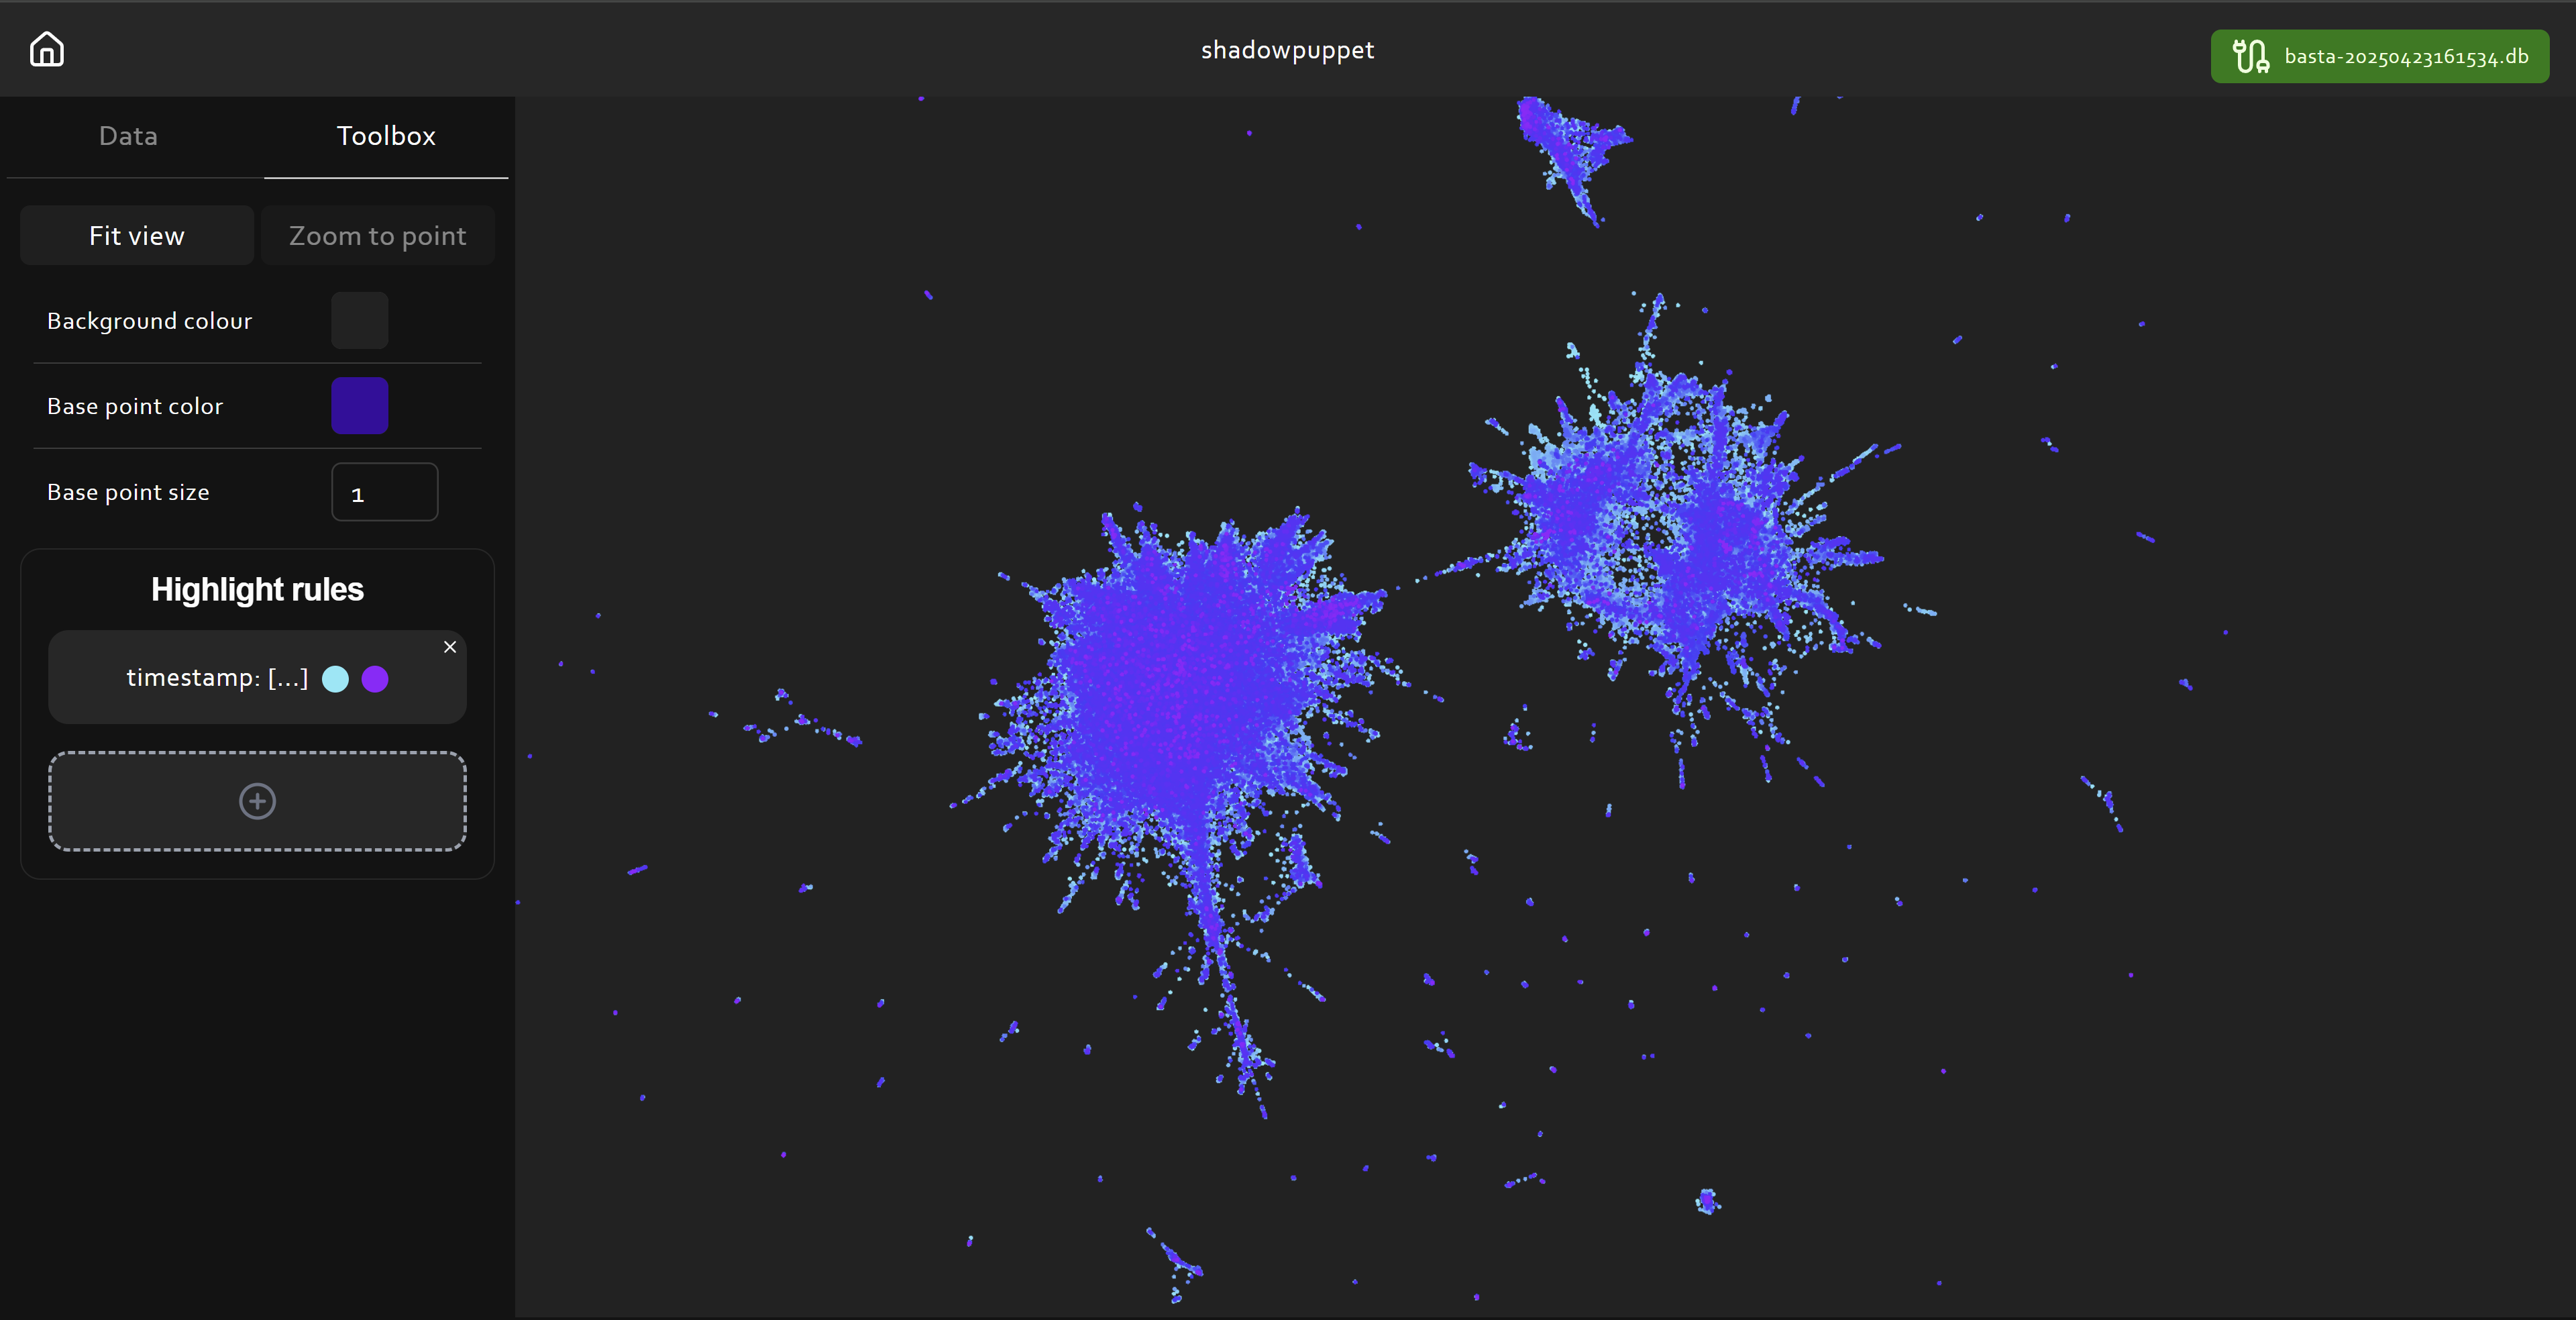
Shadowpuppet works by reading input data into a local sqlite database and embedding a target field. Embeddings are very computationally expensive, so Shadowpuppet writes embeddings into the database to avoid double processing. Each time a database is visualised, a new projection is created and the user can view point data by clicking on points. The user can also create complex rules to highlight certain points based on queries executed against the database. This process of dynamically exploring the data is the key feature of Shadowpuppet. Shadowpuppet should comfortably handle datasets well into the hundreds of thousands of rows on most devices.
Demo on the Black Basta Leaks
I'm going to briefly demo Shadowpuppet using matrix chat logs leaked from the Black Basta cyber extortion group in February 2025. My intention is not to provide a comprehensive analysis of the leaks, rather how you'd go about loading and starting to explore this data using Shadowpuppet. The Black Basta leak was originally publicly identified by PRODAFT and I sourced the data used here from D4RK-R4BB1T.
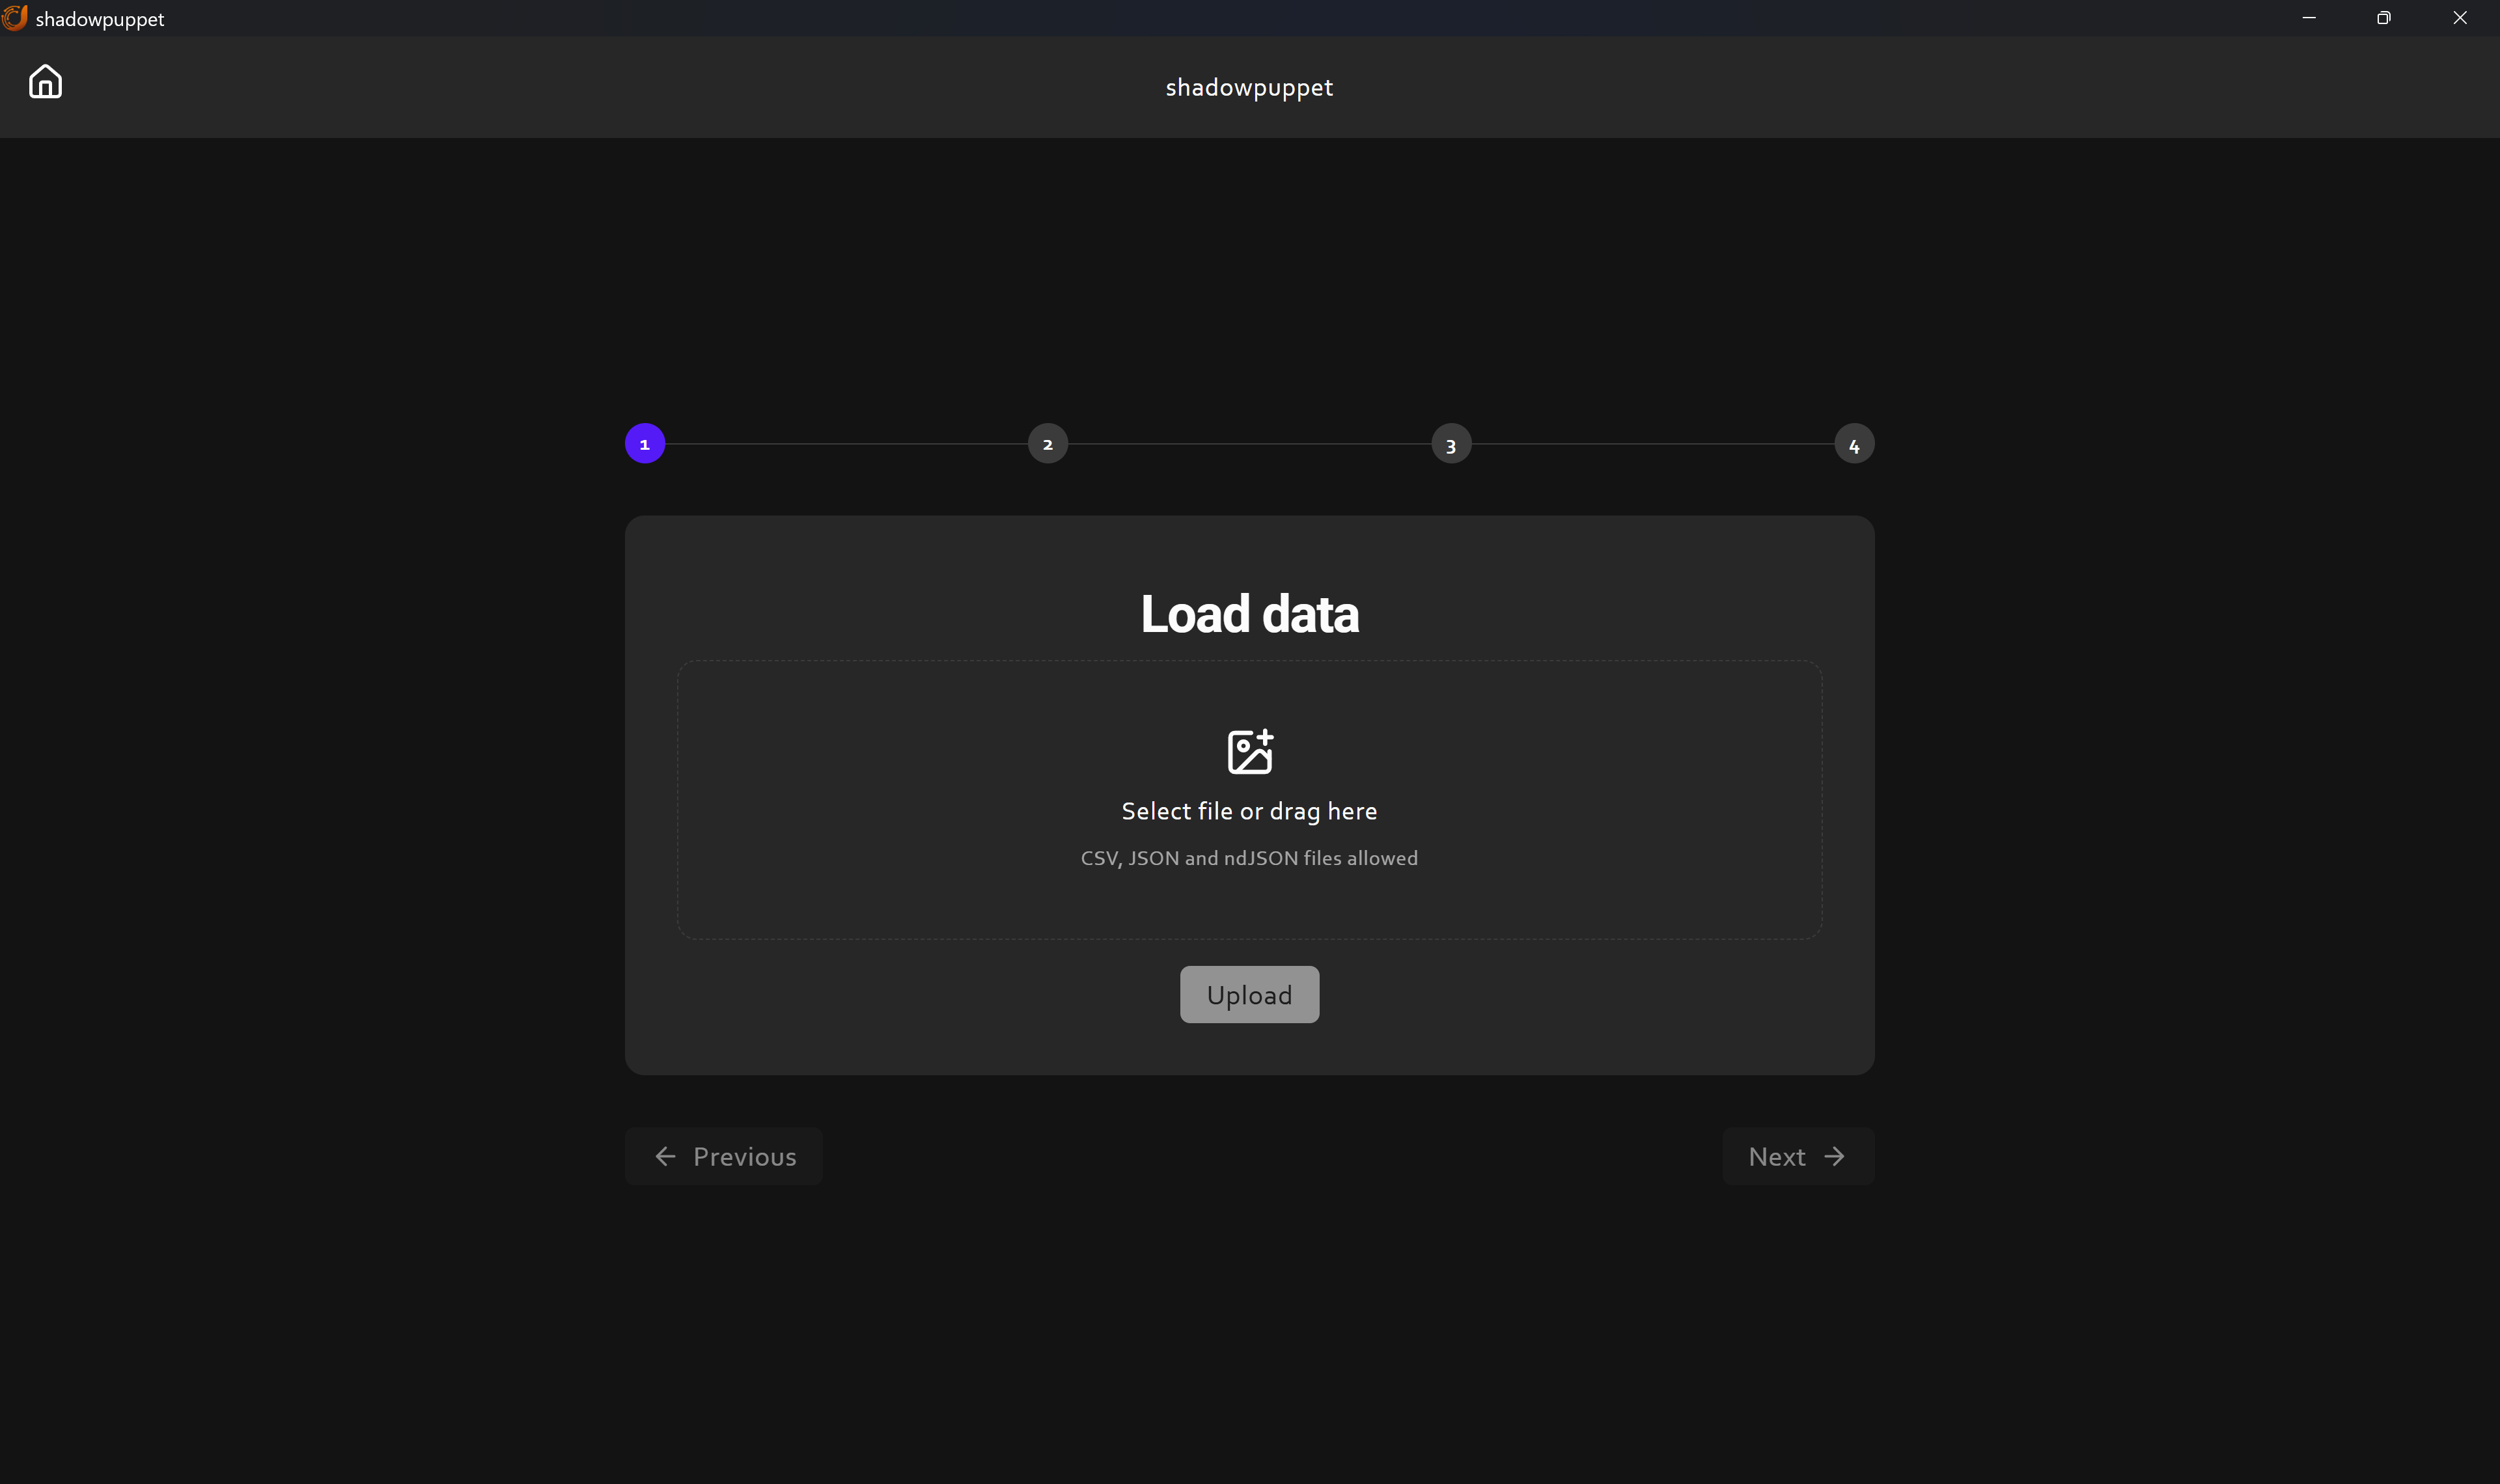
I started by cleaning up the data with a script to reformat the messages into valid JSON then fired up Shadowpuppet. The leak consists of 195,882 messages, primarily in Russian, but including some mixed-language content and some code. You may wish to translate the data before you run an analysis like this, but it's worth noting that many embedding models are multilingual and will handle mixed-language data. The leaks include a timestamp, a message sender and message text. We're going to target the message text as the field we embed but I'll demonstrate how we can use the other fields in our analysis. Below is a walkthrough of using Shadowpuppet to explore the Black Basta leaks.
I'll keep adding features to Shadowpuppet as my workflow evolves but if there's something that would be useful to you, please let me know in an issue on the repository. Additional features are likely to include the ability to embed labels, preset high-contrast colour scales to increase visual clarity and handlers for more embedding models and dimension reduction techniques.
Whether you're sifting through communications data, analysing code at scale, hunting over command line history or tracking information operations, semantic scatter plots are a useful technique to have in your toolkit. They can help you find patterns that you might not have thought to look for and can be a great first step on large datasets. Hopefully this blog has given you some ideas for how semantic scatter plots could be useful to you and a running start to get visualising. Happy hunting!